
Recording value
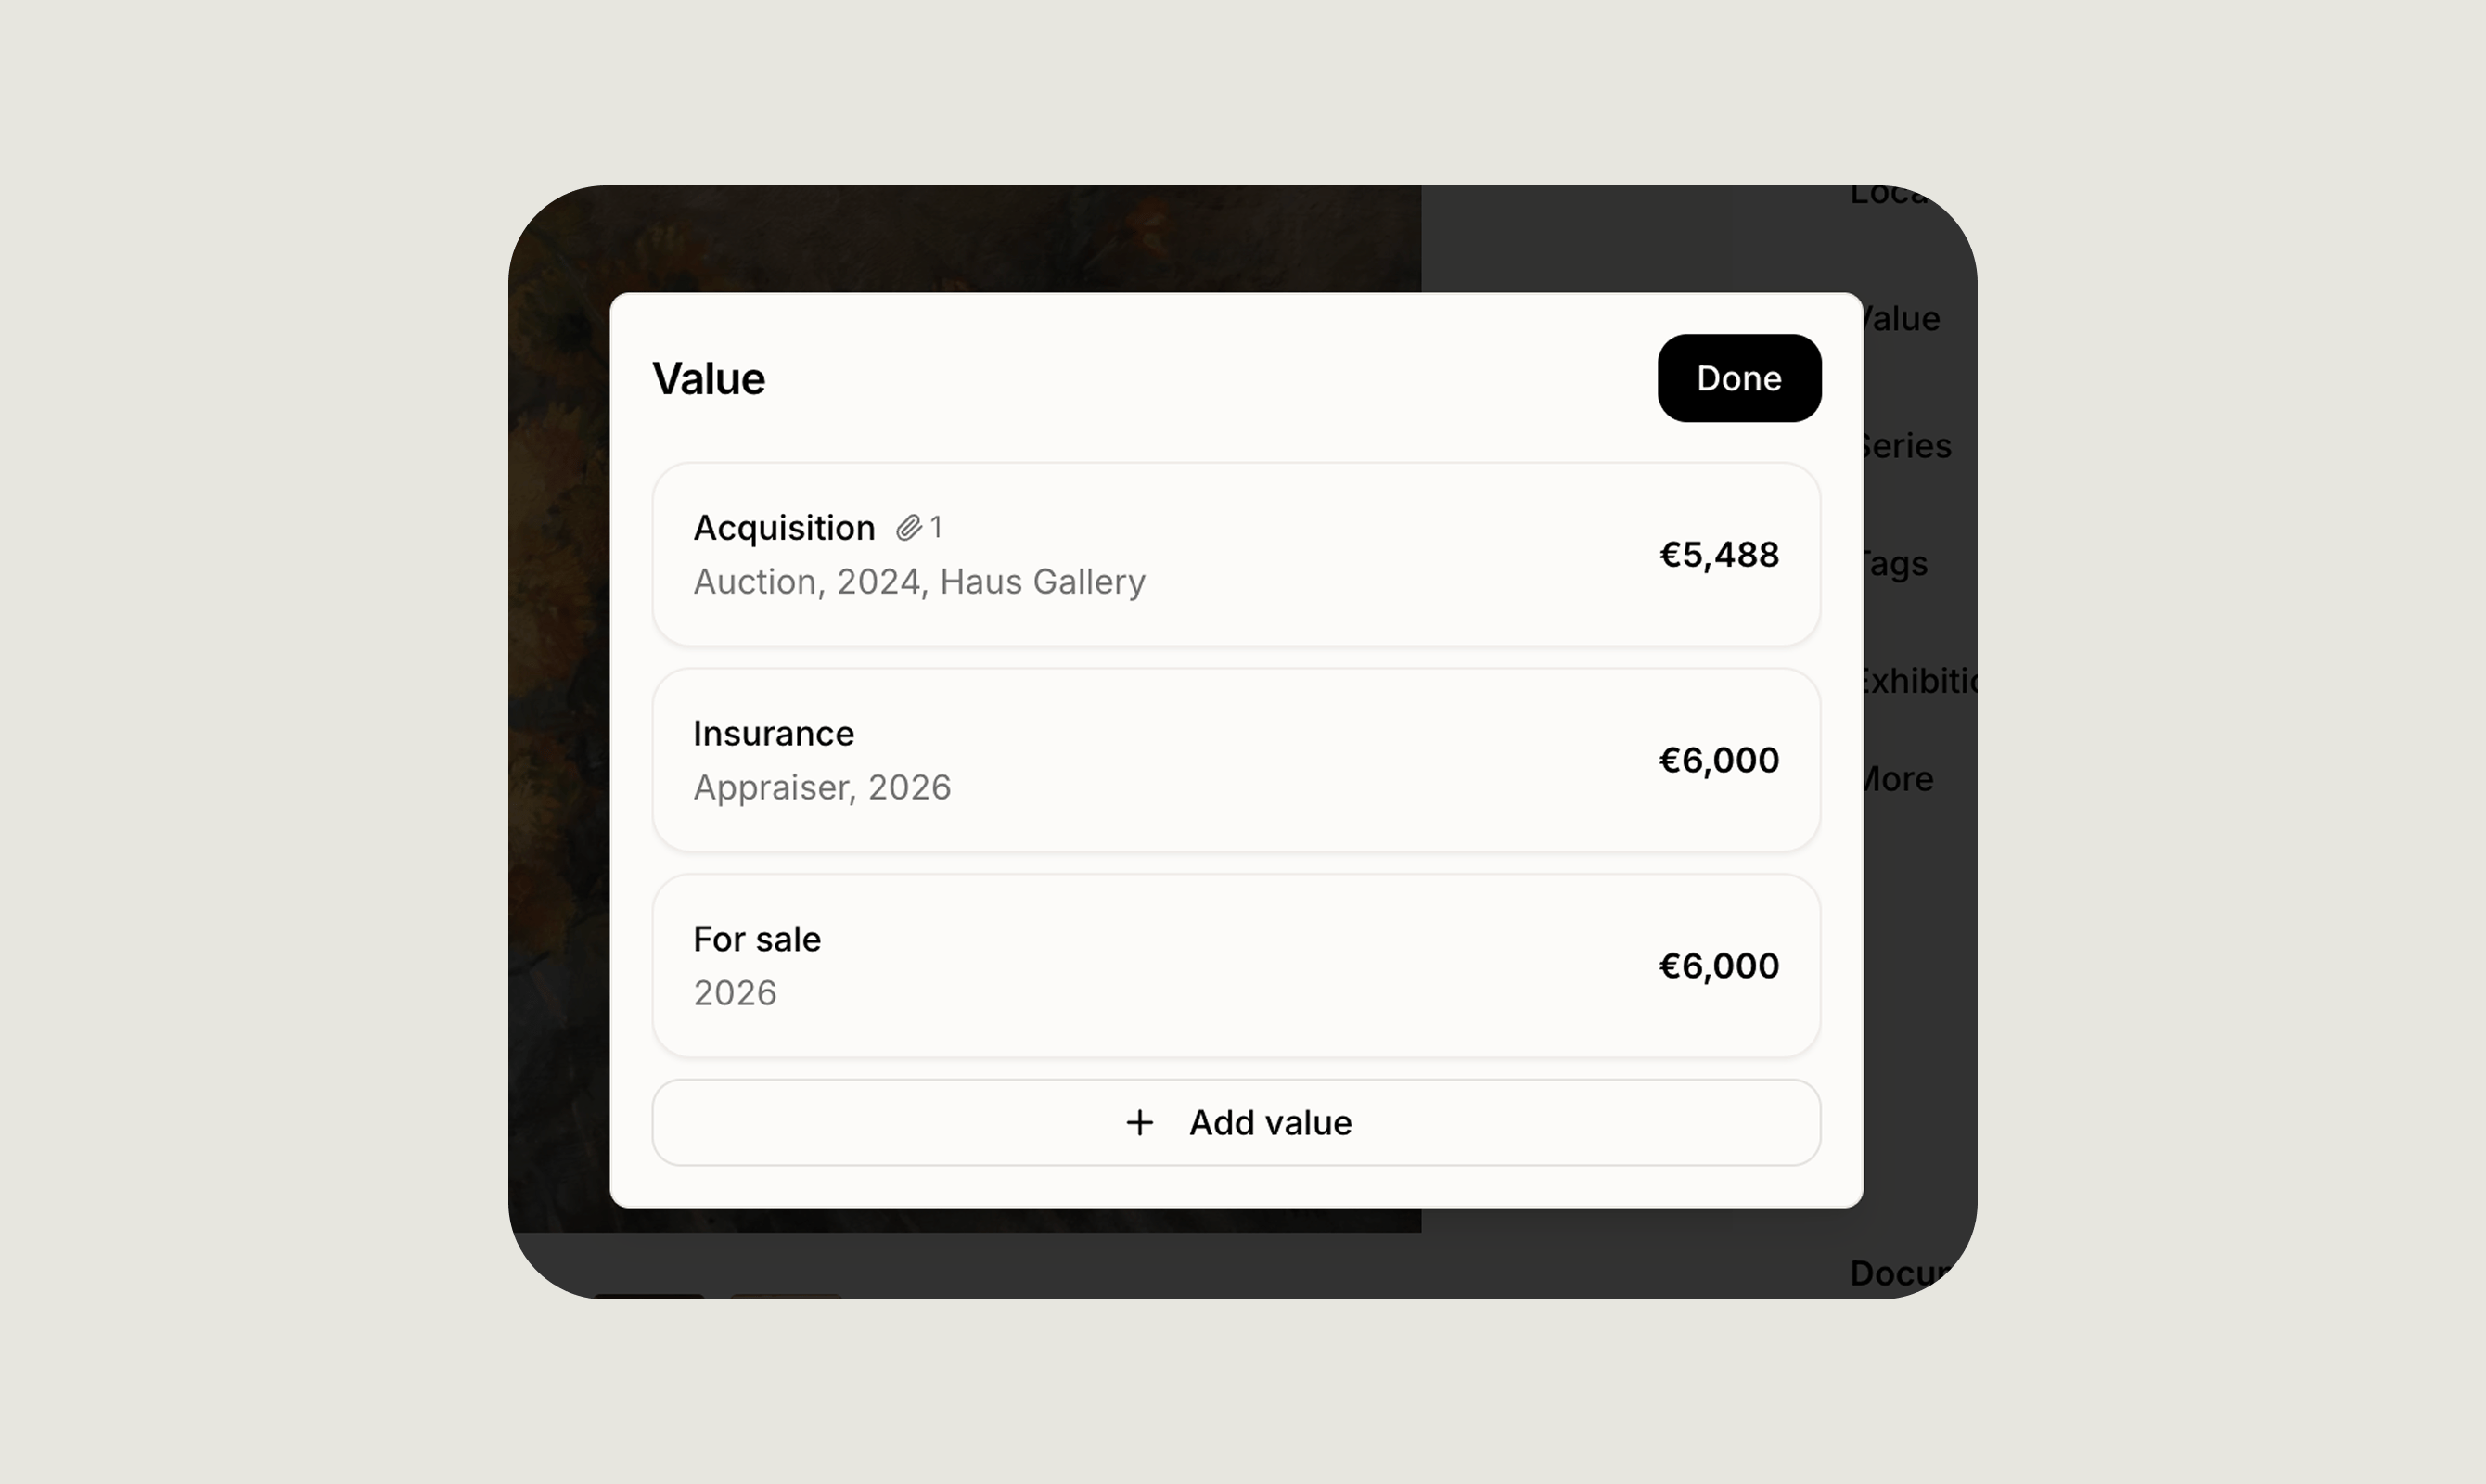
Open any artwork, go to the Value section and click Add value to choose what kind of entry you are recording:- Acquisition, what you paid for the work
- Valuation, an appraisal or your own estimate
- Insurance, the insured replacement value
- Sale price, what the work is currently offered at, or what it sold for
What each entry records
Every entry records a currency, an amount and a year, with Add date if you want an exact date rather than a year alone. All four can have documents linked from the files already uploaded to the artwork, such as an invoice, an appraisal report or an insurance schedule. What changes between them:- Acquisition is what you paid in total, including any buyer’s premium or fees. Record where the work came from, choosing between artist, gallery, art fair, auction, estate or other, and add a note with any further detail.
- Valuation is what the work is judged to be worth, whether by a professional or by you. Record the source, choosing between gallery, auction, appraiser, self or other, and add a note.
- Insurance is the replacement value the work is covered for. Same fields as a valuation.
- Sale price asks whether the figure is an asking price or what the work sold for. Choosing Sold for opens two further fields: the channel it sold through, either gallery, auction, art fair or other, and the buyer’s name or organisation.
Insights
Insights summarises the artworks currently visible in your list. Because it reads your current view, filtering or searching first will scope the numbers to that selection.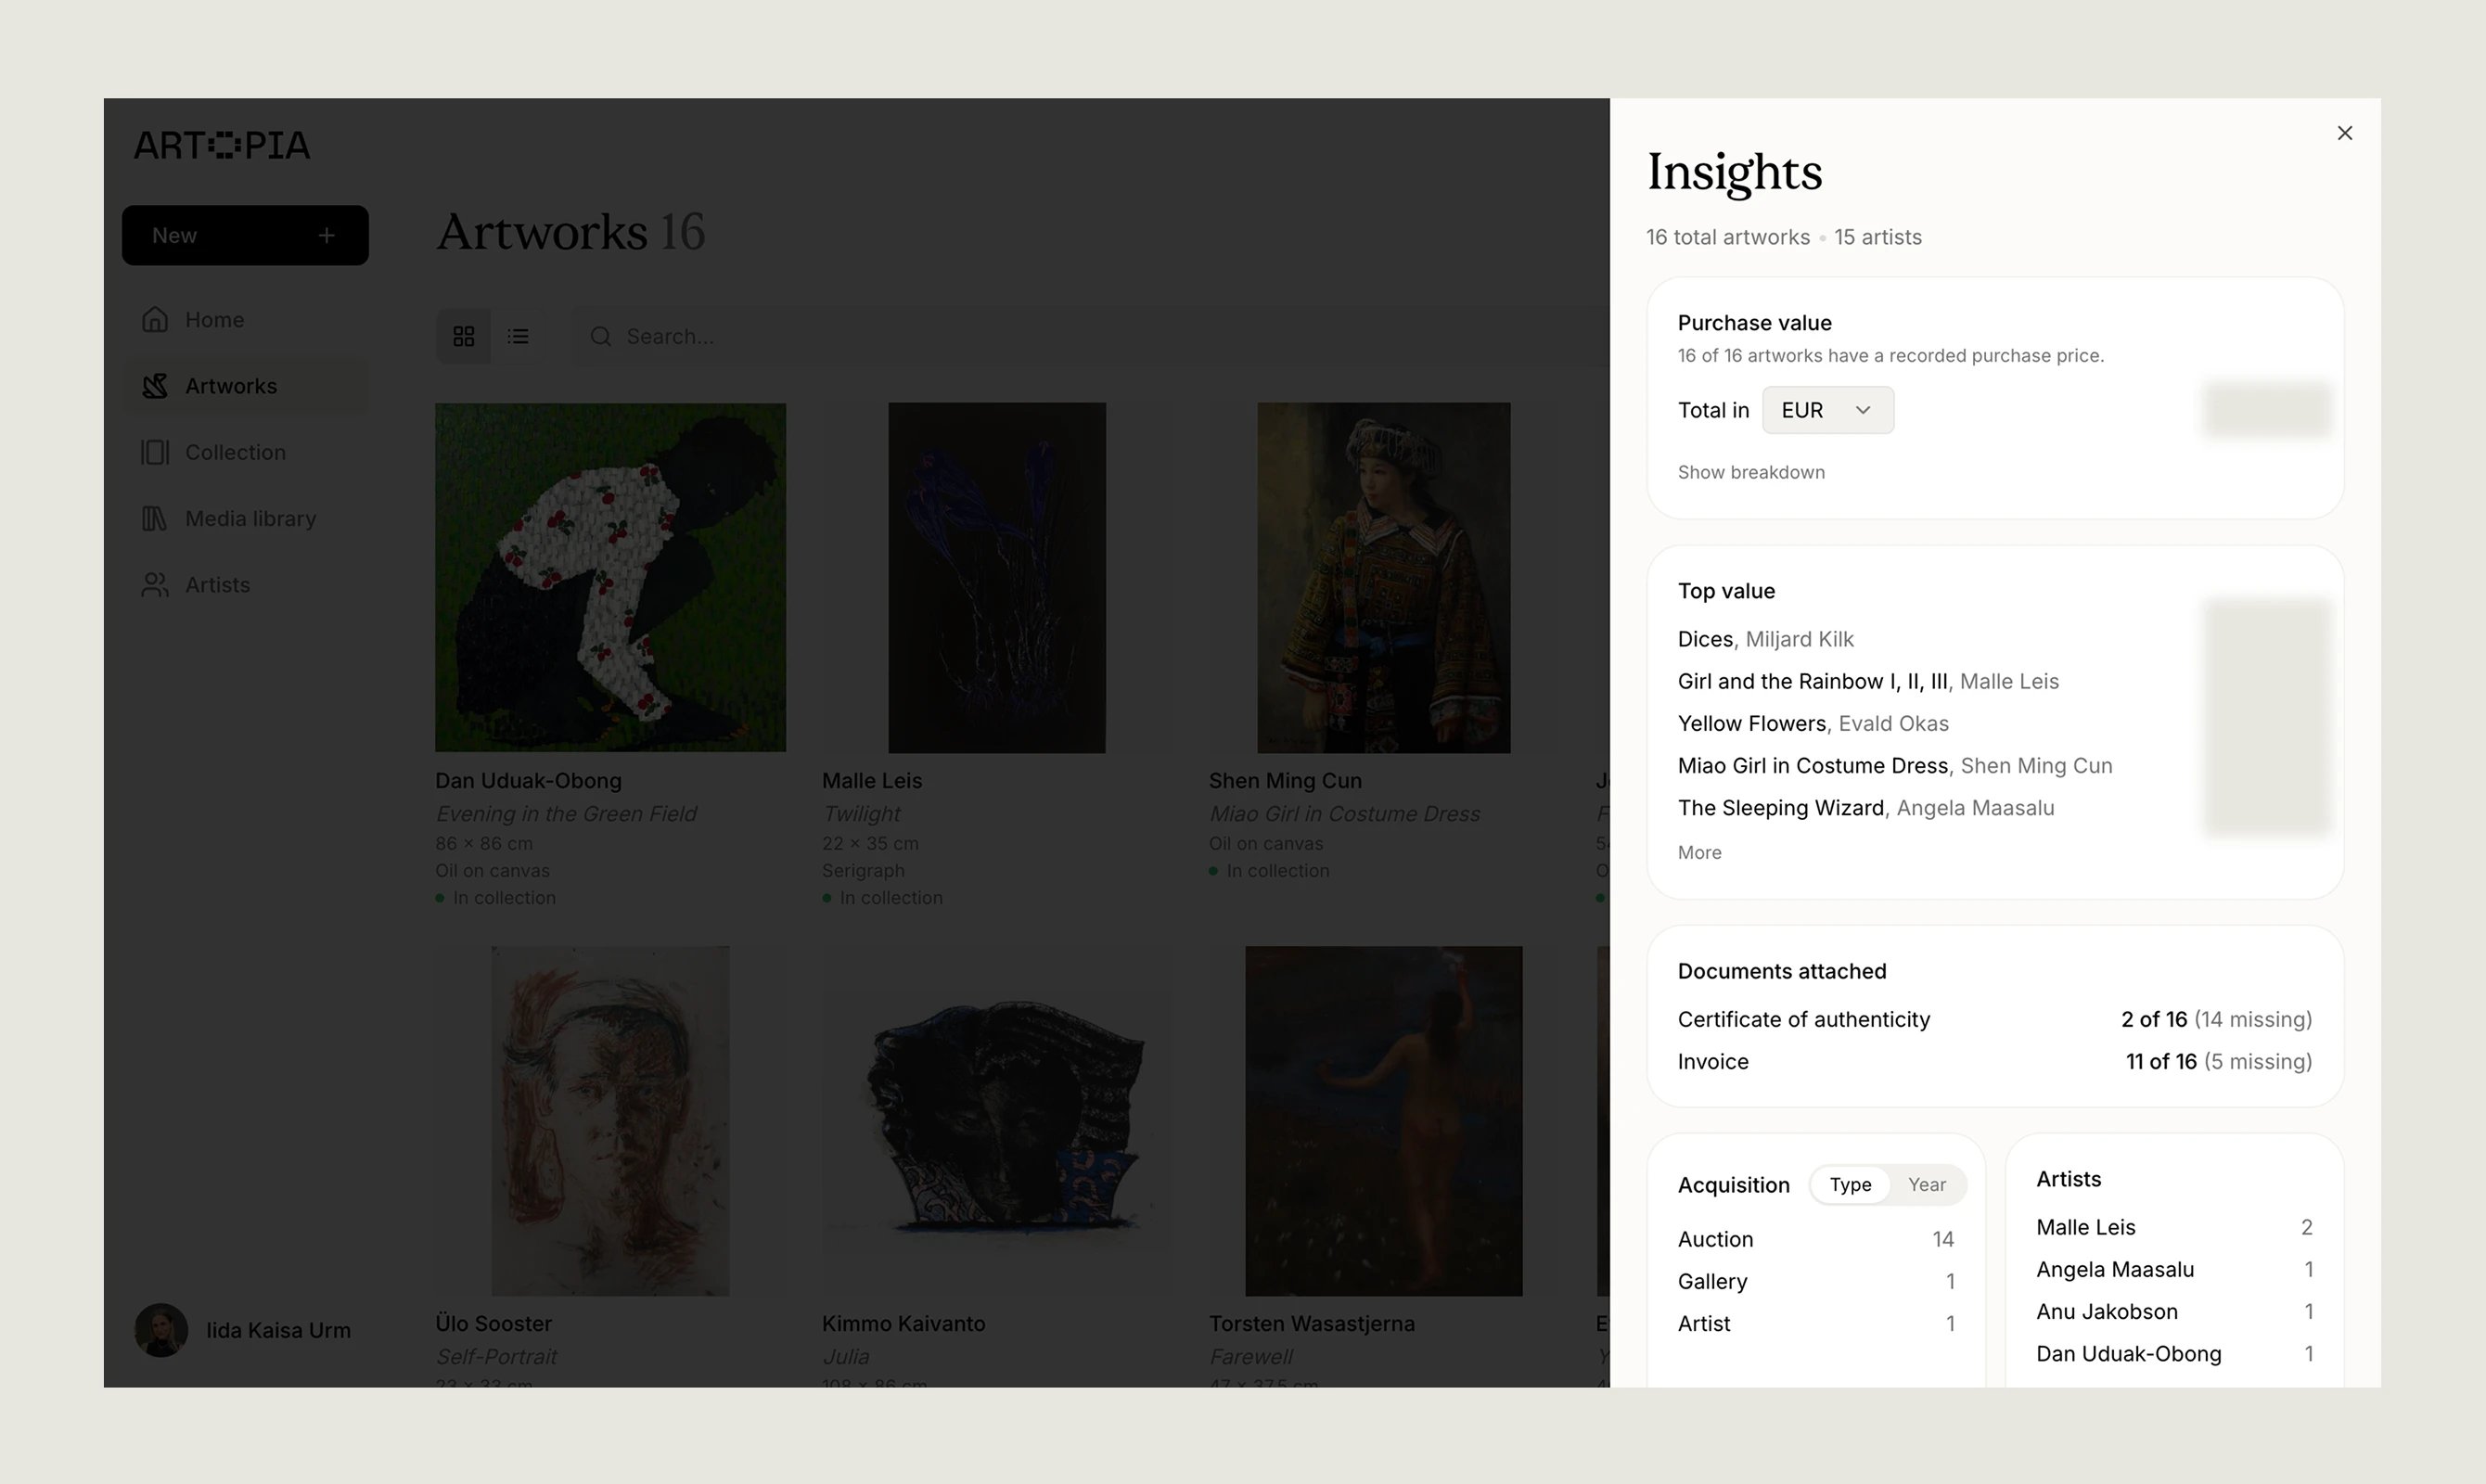
Opening Insights
From the Artworks list, click the Insights button in the top bar on desktop, or in the header on mobile. It opens as a panel over the list, so you do not lose your place.What’s inside
Purchase value
Purchase value
How many of the visible artworks have a purchase price recorded, and the total across them. Choose which currency to see the total in and Artopia converts using live exchange rates.
Top acquisition value
Top acquisition value
Your five highest works by purchase price, each with its artist and price, expandable to ten.
Documents attached
Documents attached
How many artworks have a certificate of authenticity and how many have an invoice, with the number missing alongside.
Acquisition
Acquisition
Your acquisitions grouped by source or by year, with a count for each, expandable to ten. Works with no source recorded are grouped together.
Artists
Artists
Your most represented artists by number of works in the current view.